Improve Student Test Performance on Math Regents
|
|
Veronica Kourany V.Kourany@gmail.com Gregorio Luperon High School 9th and 10th Grade |
|
INTRODUCTION:
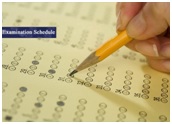
At Gregorio Luperon High School, the students’ regents results show the average is below the citywide average. The principal and the teachers offer extra review after school, try their best to provide resources and conduct mock regents to try to improve those results every year. Students need to be aware of these results. We want you to be a Public Policy Analyst and get involved on how to improve our test scores. You will be responsible for analyzing the problem, coming up with a solution and presenting your findings.
TASK
Your task is to identify reasons why students score low on the regents. You will be working in groups of four and each person will have a role. Each group will present to the class their solutions creating:
|
|
PROCESS/RESOURCES
You will be broken up into groups of 4 and within your groups you can decide who will write the Essay, who will create the PowerPoint, who will be the collector and organizer of the evidence/data and finally, who will be the presenter of the group.
- In your essay,
you need to address the problem, include your evidence, identify the
causes and include your solution. Use the worksheets provided from the six
steps of the PPA found below to gather all your information before
starting your essay.
- In your
PowerPoint, you need to address the problem, include your evidence,
identify the causes and include your solution. Display the evidence on the
PowerPoint (with a chart, pictures, etc.….)
- To collect
evidence (can be included within the PowerPoint):
· Research previous data and organize it in a matter where you can display it.
· Create a personal survey for students in the school to answer and organize your findings to display.
Your group will use the 6 steps of the Public Policy Analyst (PPA).
1. Define the
Problem (given)
2. Gather the Evidence using Worksheet #2
3. Identify the
Causes using Worksheet #3
4. Evaluate an
Existing Policy using Worksheet #4
5. Develop
Solutions using Worksheet #5
6. Select the Best Solution
(Feasibility vs. Effectiveness) using Worksheet #6
Resources you can use:
- 2017-18 Luperon School Report Card Data
- 2016-17
Luperon School Report Card Data
- Luperon Report Card Data (2003-2016)
- Math Regents for ELLs
- Graduation Requirements
for ELLs
EVALUATION
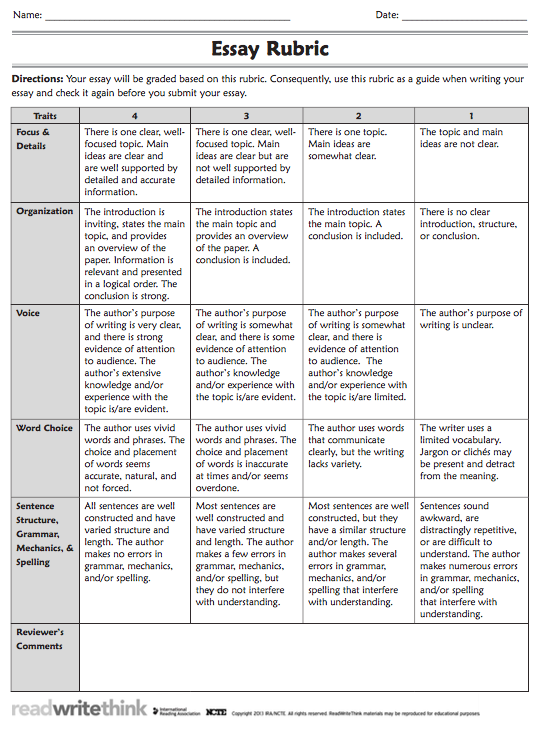
Rubric for PowerPoint and Oral Presentation
|
|
Awesome 4 |
Admirable 3 |
Acceptable 2 |
Unacceptable 1 |
Self- Assessment |
Teacher Assessment |
|
Critical thinking |
Thoughtfully and accurately interprets results, shows in-depth understanding of major ideas |
Identifies relevant arguments, justifies results, offers reasons |
Usually justifies results and offers reasons |
Misinterprets data, gives unjustified arguments |
|
|
|
Quality of information |
Covers topic thoroughly, includes details that support the topic |
Includes essential information, includes some supporting details |
Includes most essential information, details are somewhat sketchy |
Lacks essential information |
|
|
|
Organization |
Well organized and coherent, topics are in logical sequence, includes clear introduction and conclusions |
Organized, some topics are out of logical order, conclusions are generally clear |
Some organization, topics jump around, conclusions are unclear |
Not organized, topics make no sense |
|
|
|
Grammar and spelling |
All grammar and spelling are correct |
Only one or two errors |
More than two errors |
Very frequent grammar and/or spelling errors |
|
|
|
Visual design |
Visually appealing, clean simple layout, text is easy to read, graphics enhance understanding of ideas |
Visually attractive, text is easy to read, colors enhance readability, graphics and special effects do not distract from understanding ideas |
Text is sometimes hard to read, sometimes graphics or special effects distract from understanding |
Text is very difficult to read, layout is cluttered and confusing |
|
|
|
Oral presentation |
Well prepared, speaks clearly, makes eye contact with audience, delivers with ease, invites questions |
Engages audience, fluid delivery, uses different approach other than simply reading screen, invites questions |
Clear and understandable, uses limited delivery techniques |
Not clear, not understandable |
|
|
|
Teamwork |
Willingly accepts and fulfills individual role in group, sensitive to feelings and needs of group members |
Fulfills individual role within group without prompting, respectful of others |
Works toward group goals with occasional prompting, maintains positive attitude |
Works toward group goals only when prompted, needs occasional reminders to be sensitive to others |
|
|
|
|
|
|
|
Total |
|
|
CONCLUSION
You have conducted your Public Policy Analyst with using the six steps on the issue of Student Performance on Mathematical Regents. Congratulations!
STANDARDS
NYS Standards
Social Studies
Standard 1: Students will use a variety of intellectual skills to demonstrate their understanding of major ideas, eras, themes, developments, and turning points in the history of the United States and New York.
ELA
9-10R1: Cite strong and thorough textual evidence to support analysis of what the text says explicitly/implicitly and make logical inferences; develop questions for deeper understanding and for further exploration.
Mathematics
Statistics and Probability
AI-S.ID.1. Represent data with plots on the real number line (dot plots, histograms, and box plots).